Changelog

What’s new in Zharp, release by release.

rss_feedFollow updates
Maintenance

See what's in maintenance now, what's next and what's done
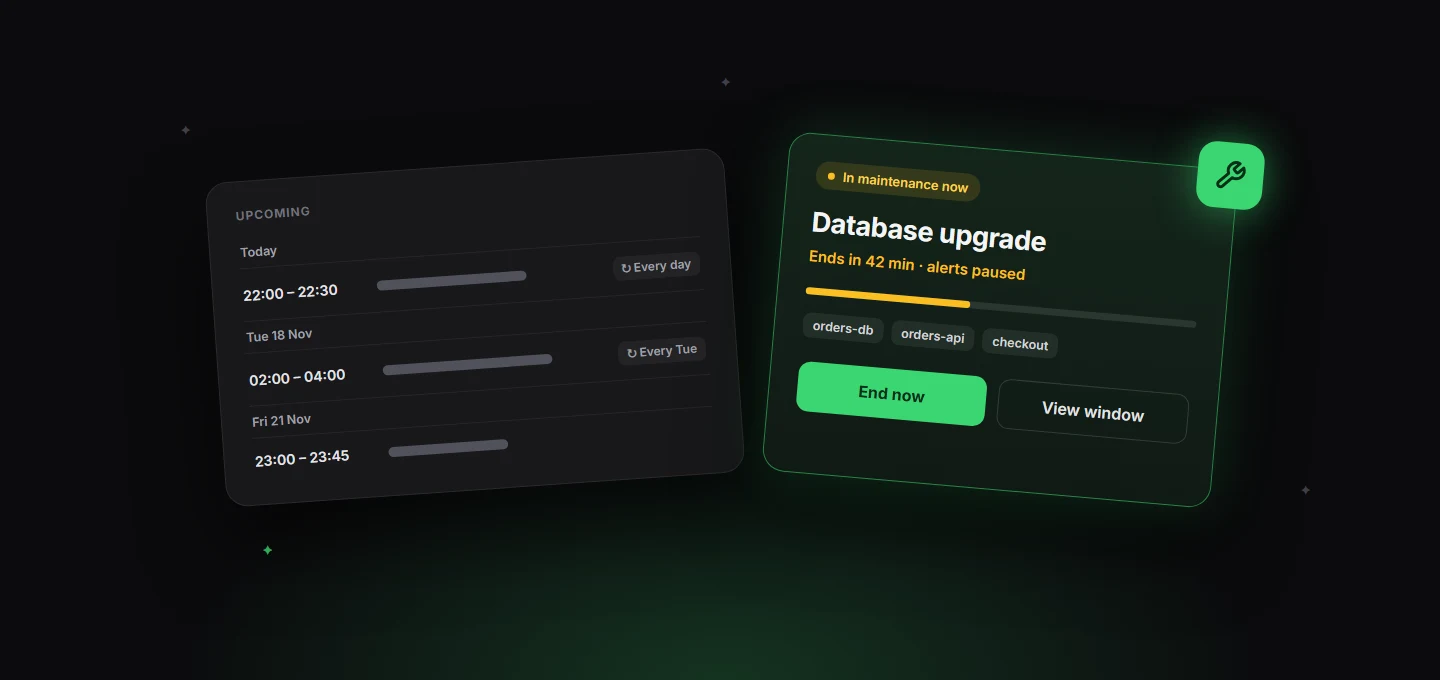
The Maintenance page now starts with what matters right now: a window in progress shows how long is left, which monitors are paused, and an End now button to bring alerts back early. Everything still to come is grouped by day, with repeating windows marked, and finished windows fold into one line you can open when you need the history.

  • In maintenance now: time left, a progress bar and the monitors whose alerts are paused
  • End now on a one-off window turns its monitors' alerts back on straight away
  • Upcoming windows grouped by day, with "Every day" or "Every Tue" on the ones that repeat
  • Completed windows folded into one line, so the page isn't a table of old work
Open Maintenancearrow_forward
Monitors

A Monitors page that starts with what needs you

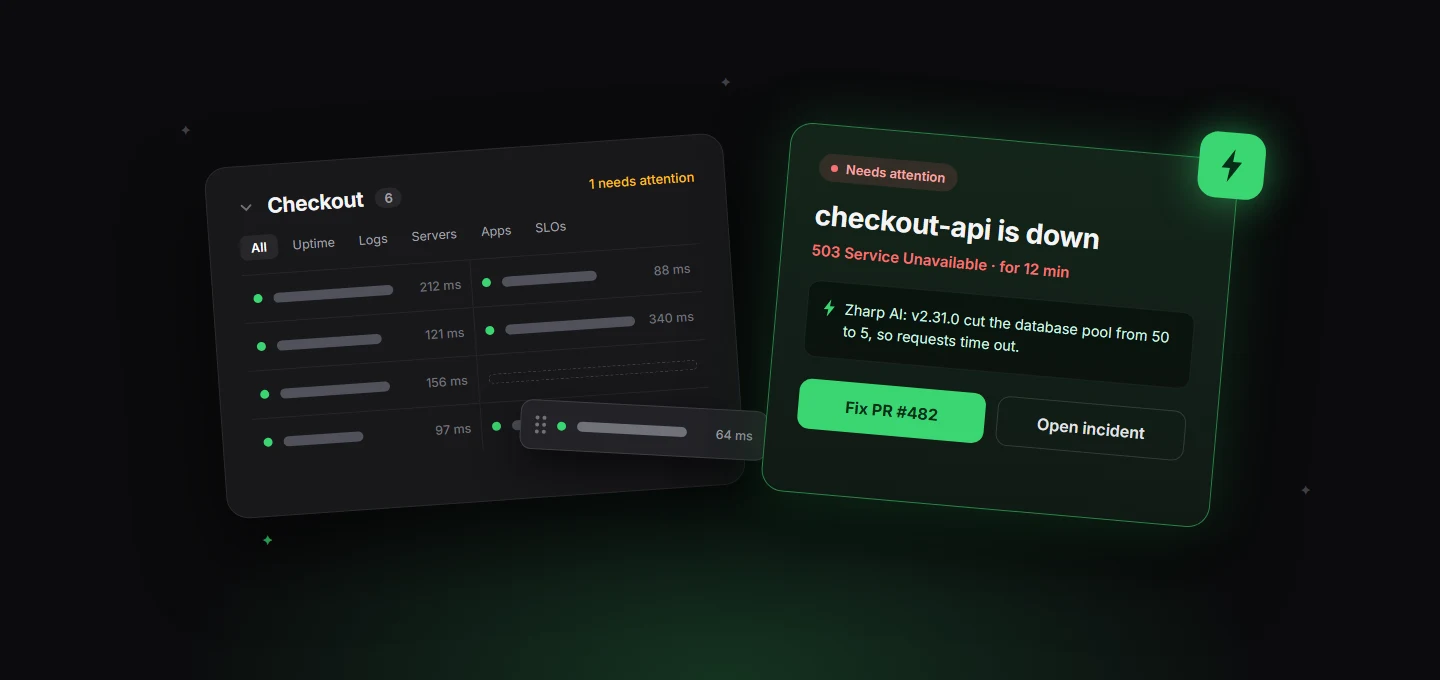
The Monitors page now opens on what needs attention: monitors that are down, degraded, or back up with an incident still open, each with what Zharp AI found and, when it has one, the pull request that fixes it. Everything healthy follows in a calm two-column list you can narrow to uptime, logs, servers, apps, SLOs, databases or pipelines. Drag monitors into the order you want inside a group, and a new workspace now shows what Zharp can watch and how it works.

  • Needs attention first: red when down, amber when it needs a look, with Zharp AI's finding and Fix PR
  • Filter healthy monitors by signal: uptime, logs, servers, apps, SLOs, databases and pipelines
  • Drag monitors into order within a group, and add one straight into a group from its empty spot
  • Create a group from the New monitor menu, and a fresh start page for empty workspaces
Open Monitorsarrow_forward
Monitors

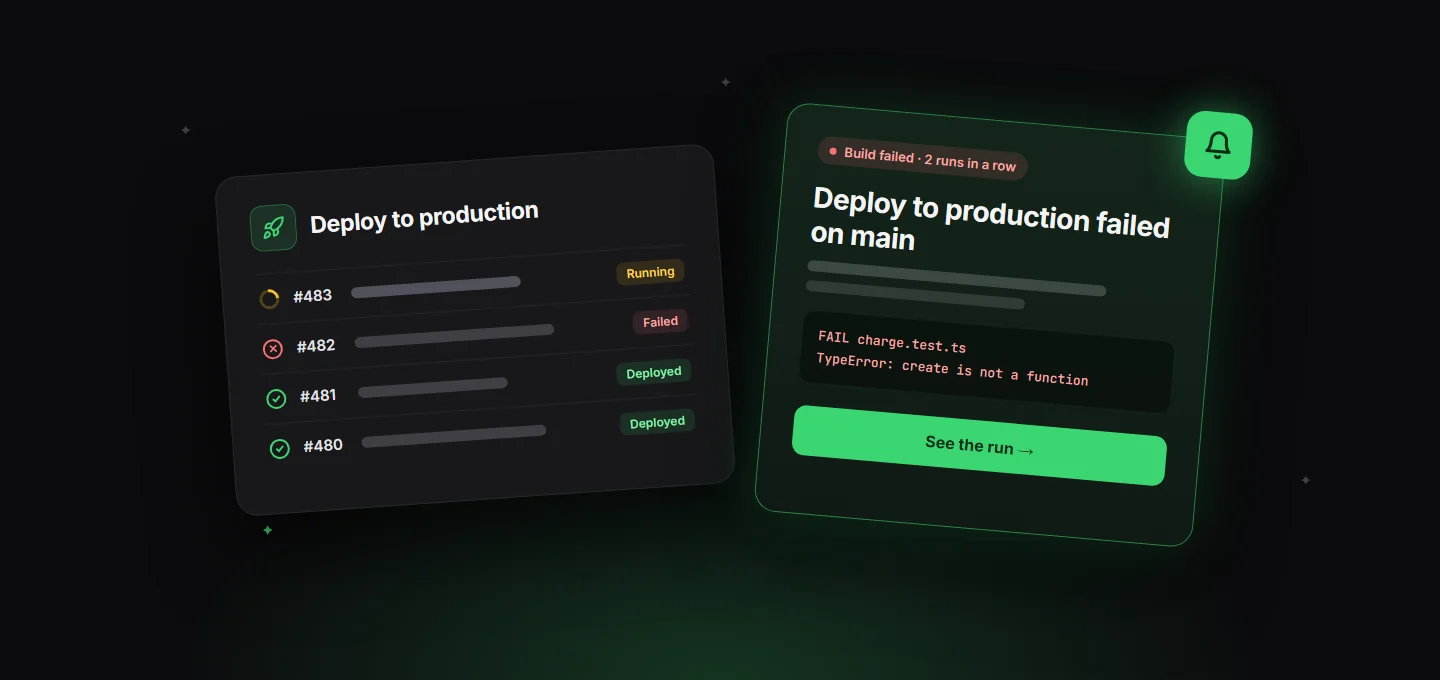
Watch your builds and deploys, and see them next to incidents

A new monitor watches a pipeline on GitHub Actions or GitLab CI, through the connection Zharp AI already uses, or on any other CI that can call a URL — Jenkins, CircleCI, Bitbucket, Azure. A failed run on your main branch opens an incident with the step it stopped at and the end of its log; a run taking far longer than usual is flagged as stuck; the next green run closes it. Every passing run is recorded as a deploy, so an incident that starts eight minutes after one says so, and Zharp AI looks at that deploy first.

  • Failed, stuck and fixed alerts on every channel, through the monitor's escalation policy
  • The run history: pass rate, usual time, the last 40 runs, and each failure's step and log
  • Deploys on every incident's timeline, and in Zharp AI's investigation
  • "Ask Zharp AI why" on a failed run, and optional notices when a deploy starts or finishes
Create a pipeline monitorarrow_forward
Incidents

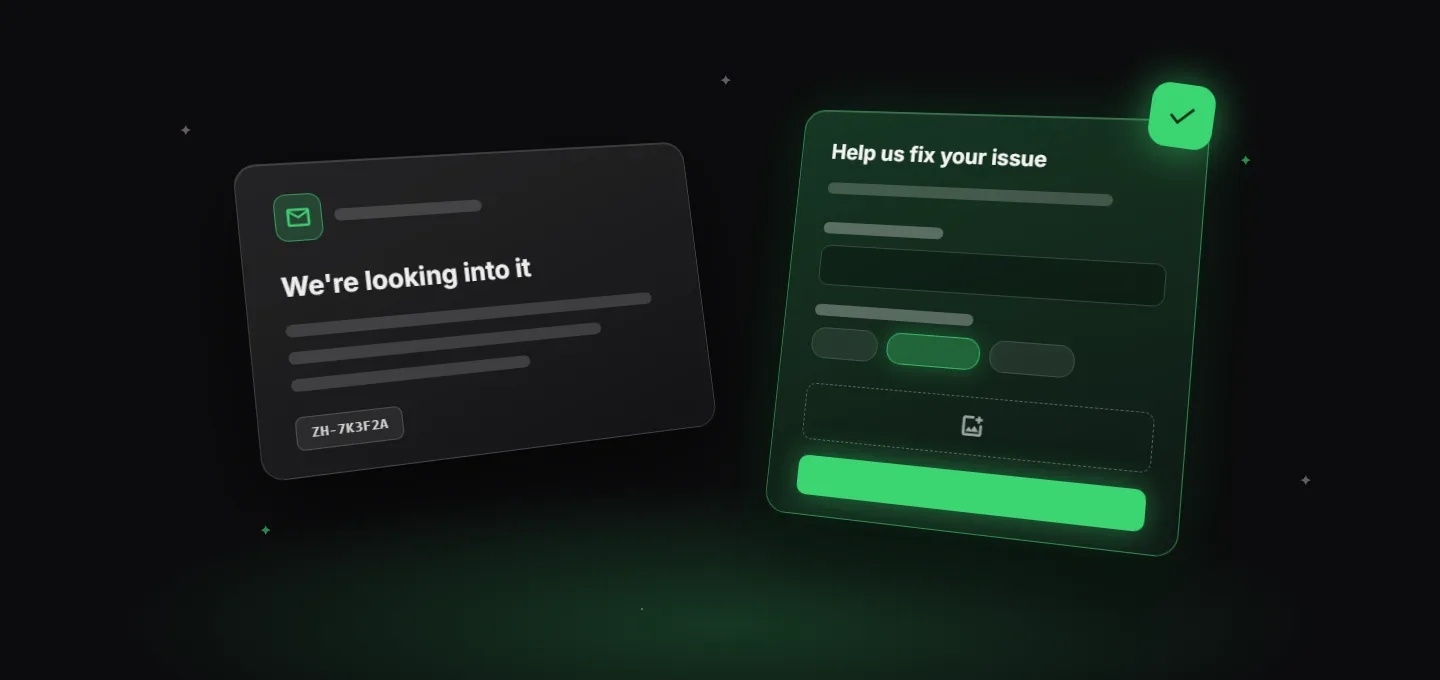
Keep reporters in the loop, and ask them what Zharp AI needs

Whoever reported an incident now hears how it's going: an e-mail when someone acknowledges it, and another when it's resolved, with an optional note from you. When Zharp AI can't find the cause, it asks the reporter a few questions it needs answered, such as when it happened and the e-mail of their account, through a short form. Their answers land on the timeline and Zharp AI looks again, this time at that person's own requests, logs and sessions.

  • "We're looking into it" and "Resolved" e-mails to the reporter, from your workspace's name
  • A note for the reporter when you resolve, sent with the e-mail
  • When Zharp AI finds no cause, questions for the reporter, then a new look with their answers
  • A Case ID on every incident, on every e-mail, and findable in search
Open Incidentsarrow_forward
Logs

Log storage that never stops, and room to grow

Your plan's logs are now storage you keep, not an amount you can send each month. Logs are never refused: when storage is full, Zharp keeps the newest and deletes the oldest to make room, and the live tail keeps running. Need more? On a paid plan, add extra storage from 10 GB to 1 TB, billed with your plan, or have it added automatically when storage fills up.

  • No more monthly cut-off: new logs always arrive, and old ones make room
  • Extra storage from 10 GB to 1 TB, from $3 per 10 GB a month and less per GB the more you add
  • A new Settings › Log storage page: what's in use, what's using it, and every change
Open Log storagearrow_forward
Applications

See what a failed request sent and got back

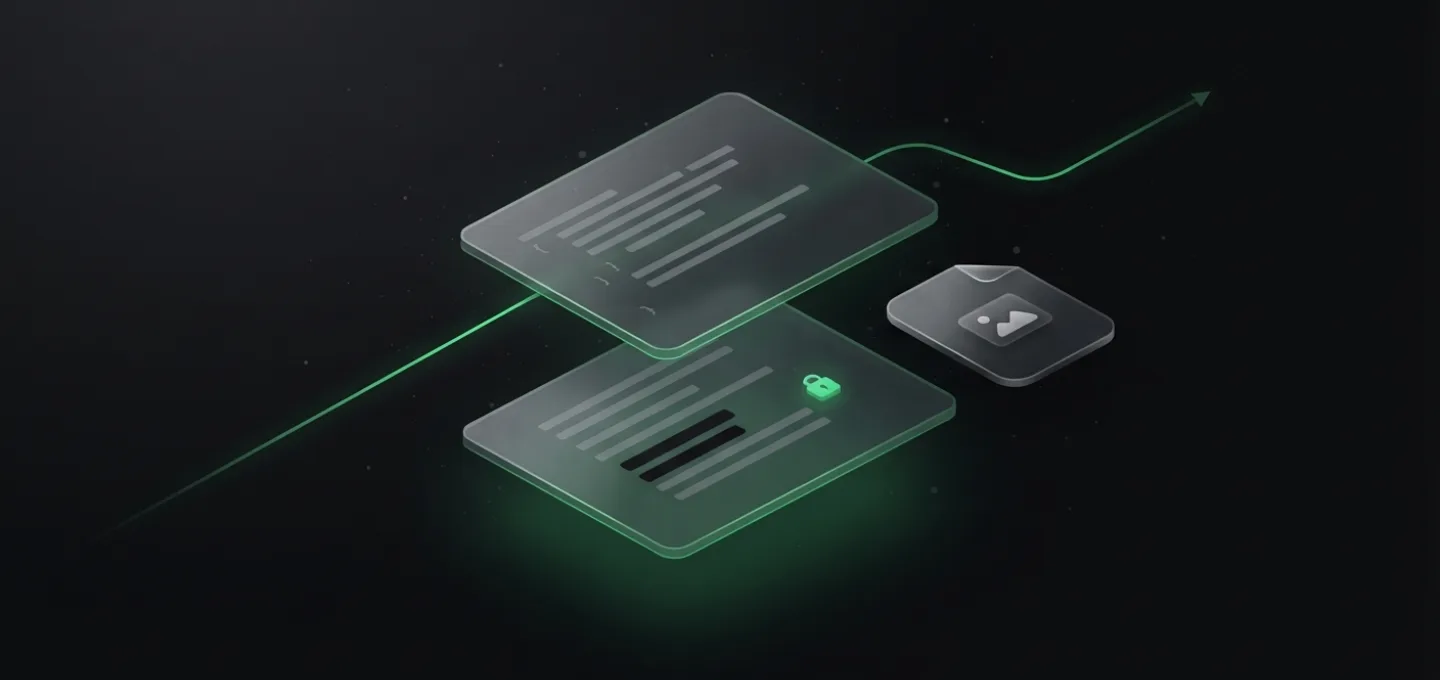
Open a request in a trace and see the payload it sent and the response it got, laid out as readable JSON. It’s off until you turn it on with one line, captureBodies, in any Zharp SDK, and by default it keeps only the requests that failed. Field names always stay; passwords, tokens and card numbers are hidden before anything leaves your app.

  • Request and response payloads under every API call in a trace, in every Zharp SDK
  • Secret values shown as [Filtered], file uploads and images described by name, type and size
  • Tokens in URLs hidden on every request, whether payloads are on or not
Open Applicationsarrow_forward
Incidents

An incident calendar, and reports you can download

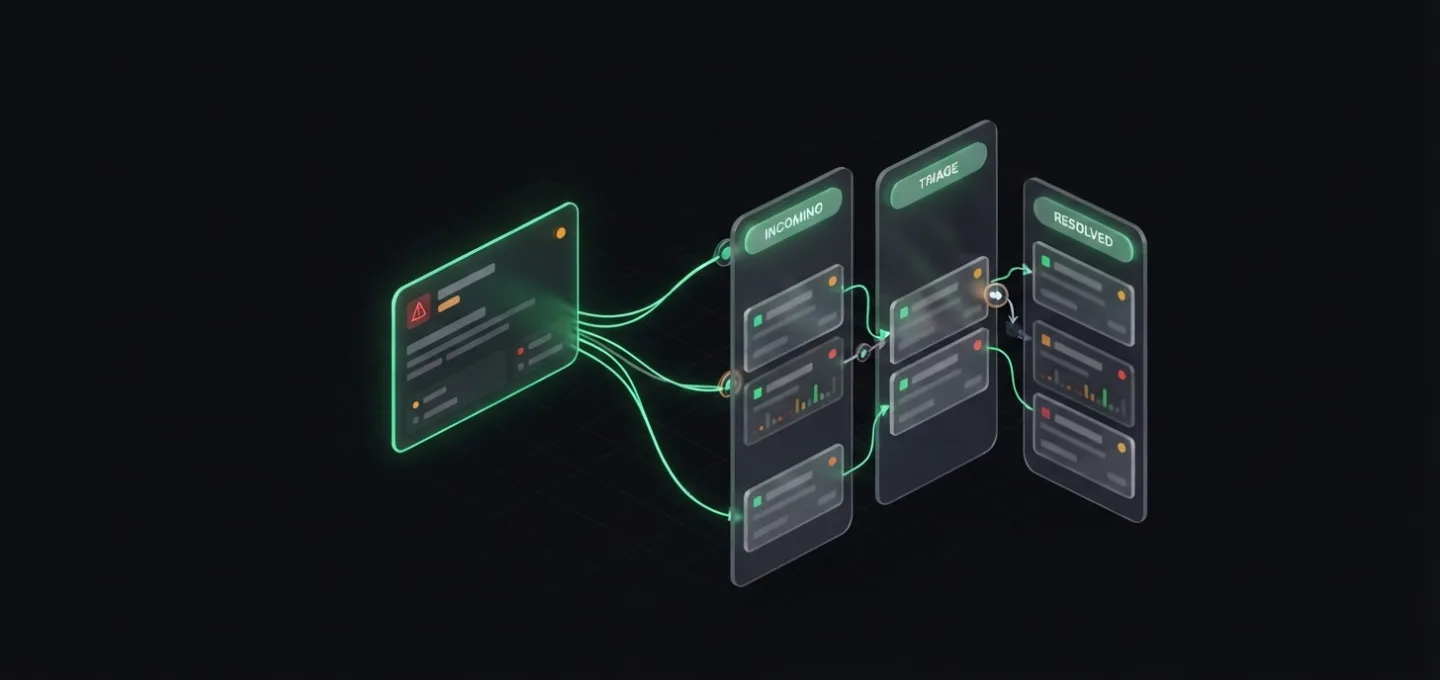
The incidents page now puts what’s still open at the top, with how long it’s been going and what Zharp AI has found so far. A calendar shows which days had incidents and how uptime held up over the month against a 99.9% target. Pick a day to see only its incidents, or download a PDF report for any dates to share with your team or your customers.

  • Open incidents pinned at the top, with a live timer and Zharp AI’s finding
  • A calendar of incident days, with the month’s uptime, downtime and time to resolve
  • PDF reports for any dates, up to a year: uptime, day by day, the monitors hit hardest and every incident
Open incidentsarrow_forward
Zharp AI

Zharp AI investigates incidents for you

When an incident opens, Zharp AI looks into it on its own: the failing checks, logs and traces across your services, recent deploys and your code. It writes what it found on the incident, and when the cause is in code it drafts the fix.

  • The likely cause, how sure it is, and the evidence, with links to see it
  • A suggested fix as a diff, ready to open as a pull request
  • Post-mortems that build on it, and say whether the fix was merged
See it on your next incidentarrow_forward
Logs

Follow one request across every service

Pick any log line with a trace and follow it: every line that request wrote, in every service it passed through, in order. Switch an app’s Logs between it and the services it talks to, or narrow it to one person.

  • A service picker and a user filter on every app’s Logs tab
  • A timeline of how long each service spent on the request
  • Logs grouped under each span in the trace view
Open an app’s logsarrow_forward
Getting started

A guided tour for new workspaces

New workspaces get a short tour of what matters first, and a Getting started checklist in the sidebar that ticks itself off as you go: your first monitor, who gets alerted, a status page, your apps and servers, and a first question for Zharp AI.

  • A five-step spotlight tour, which you can replay any time
  • A checklist that knows what’s already done
  • Hide it whenever you like
Open the dashboardarrow_forward
Settings

New Settings, and AI credits you can top up

Settings are rebuilt around what you actually change, and Zharp AI now runs on credits: a monthly allowance with your plan, packs when you need more, and auto top-up so it never stops mid-incident.

  • API keys, data backup and security in one place
  • Buy credit packs, or top up automatically
  • See what used your credits, day by day
Open Settingsarrow_forward
Integrations

Send incidents to your task tracker

Connect your task tracker and incidents turn into tasks where your team already plans work. The task follows the incident: updates are added as it goes, and it moves on when the incident is resolved.

  • ClickUp, Jira, Linear, GitHub Issues, GitLab Issues, Asana, Trello, Notion, monday.com and Azure Boards
  • Choose which incidents create tasks, and where they go
  • Each task links back to the incident
Connect a trackerarrow_forward
Incidents

Redesigned incident pages, and a link to report problems

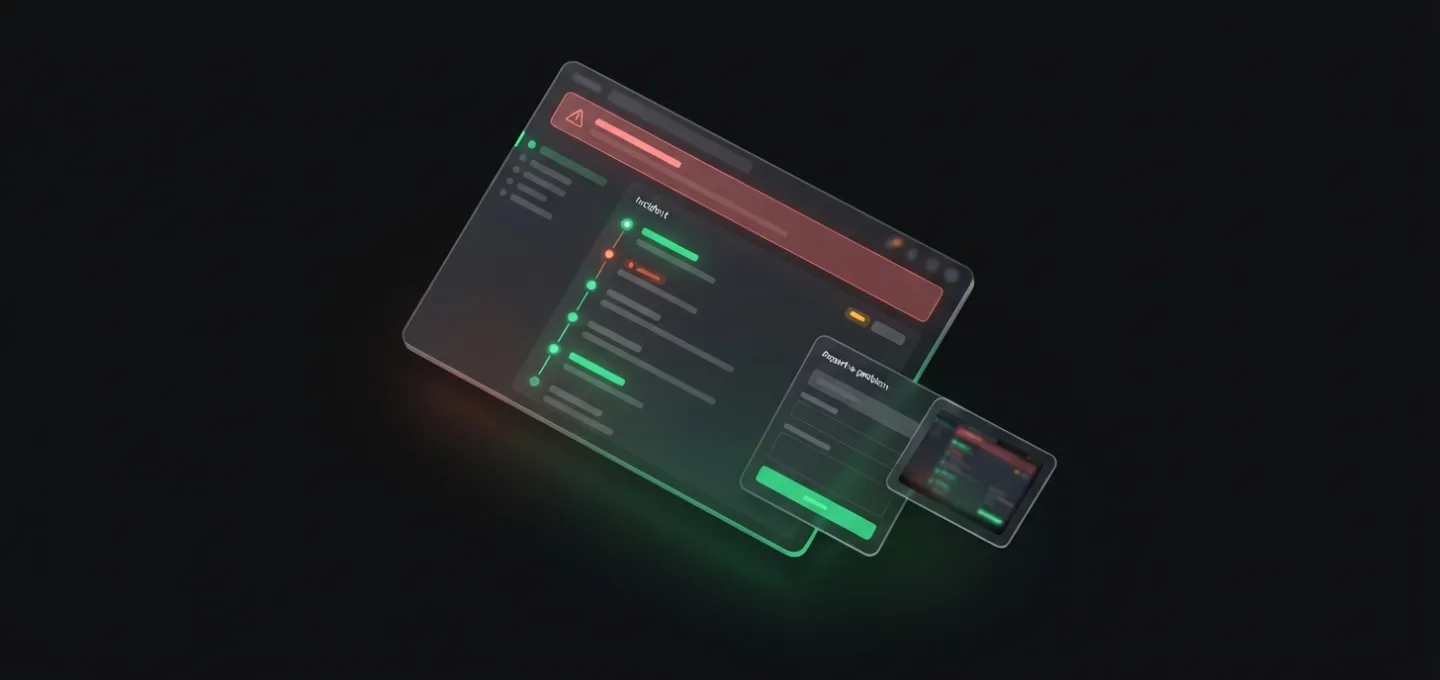
Every incident now shows what’s failing in the words of its monitor: the failing step of a journey, the expired certificate, the regions that can’t reach you. Anyone, including your customers, can report a problem from a public link, with screenshots, and mark it urgent to wake whoever is on call.

  • A page for each kind of incident, with the evidence up front
  • Lead, escalate and comment from the incident
  • A public report link with screenshots, recordings and an urgent option
Report a problemarrow_forward
Zharp AI

Meet Zharp AI, on every page

Zharp AI looks at your real data before it answers: monitors, incidents, logs, traces, errors and servers. It shows charts and replays in its answers, proposes changes for you to apply with one click, and sets up monitoring from a single sentence.

  • Ask from any page, or open it full screen
  • Charts, replays and the steps it took, in every answer
  • Changes it proposes are applied only when you say so
Ask Zharp AIarrow_forward
Zharp AI

Zharp AI reads your code and writes the fix

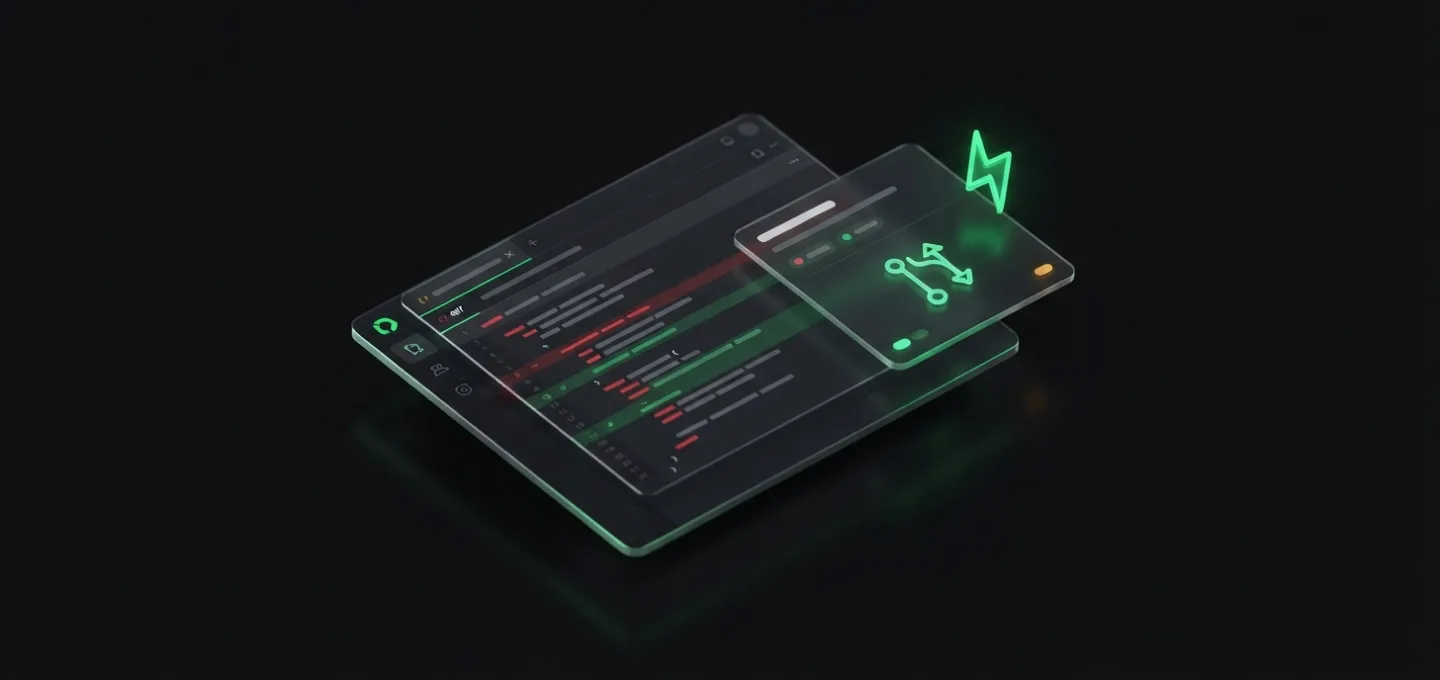
Link your apps to their repositories and Zharp AI can follow an error into your code, find the lines behind it, and write the fix. You see the change as a diff and open the pull request yourself: Zharp never merges.

  • GitHub, GitLab, Bitbucket and Azure Repos
  • Fixes shown as a diff, opened as a pull request on a new branch
  • Link each app to its repository, then ask about an error
Connect your codearrow_forward
Monitors

SLO monitors, and backups of your logs

SLO monitors track availability and latency objectives across your monitors and apps, and alert you while there’s still budget to save. Data backup copies your logs to a bucket you own every few minutes, so you keep them as long as you need.

  • Error budgets and burn rates, with alerts before they run out
  • Backups to Amazon S3, Cloudflare R2, Google Cloud Storage, Backblaze and more
  • Your bucket, your retention
Create an SLO monitorarrow_forward
Monitors

Server and container monitors, and alerts on app errors

Monitor any server or container the Zharp agent runs on, with alerts when it stops reporting or crosses the limits you set. Application monitors alert you when an app’s errors or failures rise, and Opsgenie joins the places alerts can go.

  • Server and container monitors with CPU, memory and disk limits
  • Alerts on new errors and rising error rates in your apps
  • Opsgenie, alongside Slack, PagerDuty, Teams and the rest
Create a monitorarrow_forward
Servers

See what’s using your servers

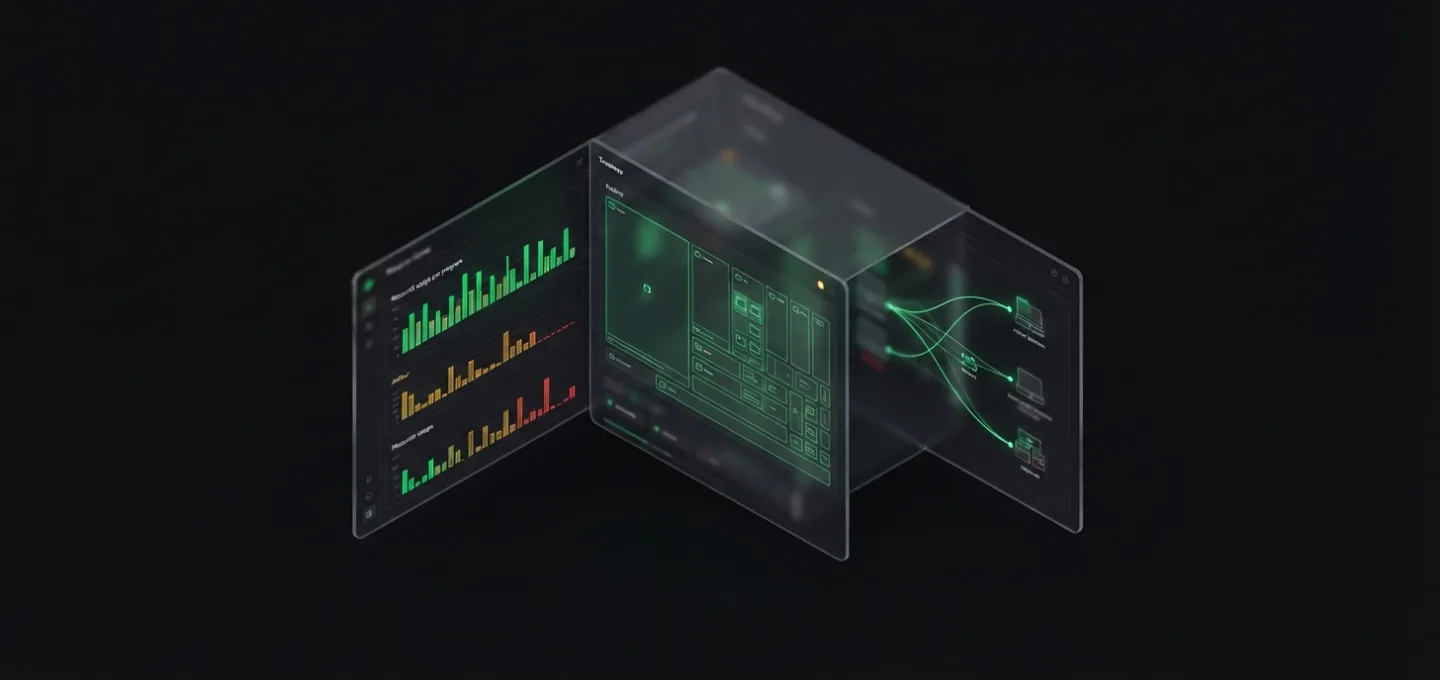
Open a server to see what’s behind its numbers: which programs use the CPU and memory, which folders fill the disk (down to the files), and which programs send traffic, and to whom.

  • Programs and containers behind CPU, memory and network
  • Folders and files taking the space, level by level
  • Who each program talks to
Open your serversarrow_forward
Applications

Application monitoring

Add the Zharp SDK or OpenTelemetry to your apps and see what your users run into: errors with readable stack traces, the requests behind them, session replays, and everything one person did.

  • Errors grouped into issues, with readable stack traces
  • Traces across your apps, and the logs written along the way
  • Session replay and a timeline for each user
Add an apparrow_forward
Servers

Servers & Containers

Install the Zharp agent on Linux, Windows, Docker or Kubernetes and every machine shows up with its live metrics, its containers and its logs, with no configuration to write.

  • Linux, Windows, Docker and Kubernetes
  • Live CPU, memory, disk and network, and each container’s share
  • Logs collected from the start
Add a serverarrow_forward
Logs

Logs, organised by service

Logs now open on an overview of every service sending them, with how much each sends. Sort them, switch between grid and list, and set noisy services aside without losing them.

  • A grid or a sortable list of your services
  • Exclude a service’s logs, and bring them back any time
  • Filter by environment, version and source
Open Logsarrow_forward
Monitors

Smarter monitor alerts

A monitor’s page now shows which regions are failing and what each one got back. When only some regions fail, the monitor is marked degraded instead of down, so you aren’t woken up for a problem in one place.

  • Every region’s result, side by side
  • Degraded, not down, when only some regions fail
  • Acknowledge straight from an escalation email
Open your monitorsarrow_forward
Plans

Every feature on every plan

Every integration and feature is on every plan, Free included. Plans differ in how many monitors, how often they’re checked, and how much data you keep, so you can start small and grow without hitting walls.

  • Every integration on every plan
  • A new Individual plan between Free and Team
  • Clear usage, so you know where you stand
See the plansarrow_forward
Status pages

Status pages on your own domain

Put your status page on your own domain. Zharp shows you the DNS records to add, checks them, and takes care of the certificate.

  • Your own domain, with HTTPS handled for you
  • The DNS records to add, and when they’re live
  • Duplicate a status page in one click
Open your status pagesarrow_forward
On-call

Escalation policies, on-call and team groups

Set who is on call, group your team, and write escalation policies that page the next person when nobody acknowledges. Connect Slack in one click and send alerts to the channel your team already watches.

  • On-call schedules and team groups
  • Escalation policies that keep paging until someone answers
  • Slack connected in one click
Set up on-callarrow_forward